Exploring Data in the Portal
Now that all of our accounts are interconnected, let's actually explore the data.
What data is here?
The data at the Kids First DRC is from children with childhood cancer and structural birth defects or their family members. As of early 2020, the Kids First DRC maintains Whole Genome Sequences (WGS) and/or RNAseq data for over 12,000 individuals. However, Kids First doesn't only host data about DNA and RNA. Using the portal you can access a wide range of data types including Histology Images, Pathology Reports, Radiology Images, Radiology Reports, Operation Reports, Annotated Somatic Mutations, Gene Fusions, Gene Expression, Somatic Copy Number Variations, and Isoform Expression.
Step 1: Get logged in to the Kids First DRC Portal
If you aren't still logged in to the Kids First Portal, navigate to https://portal.kidsfirstdrc.org/ and use the credentials you set up previously in this lesson to log in.
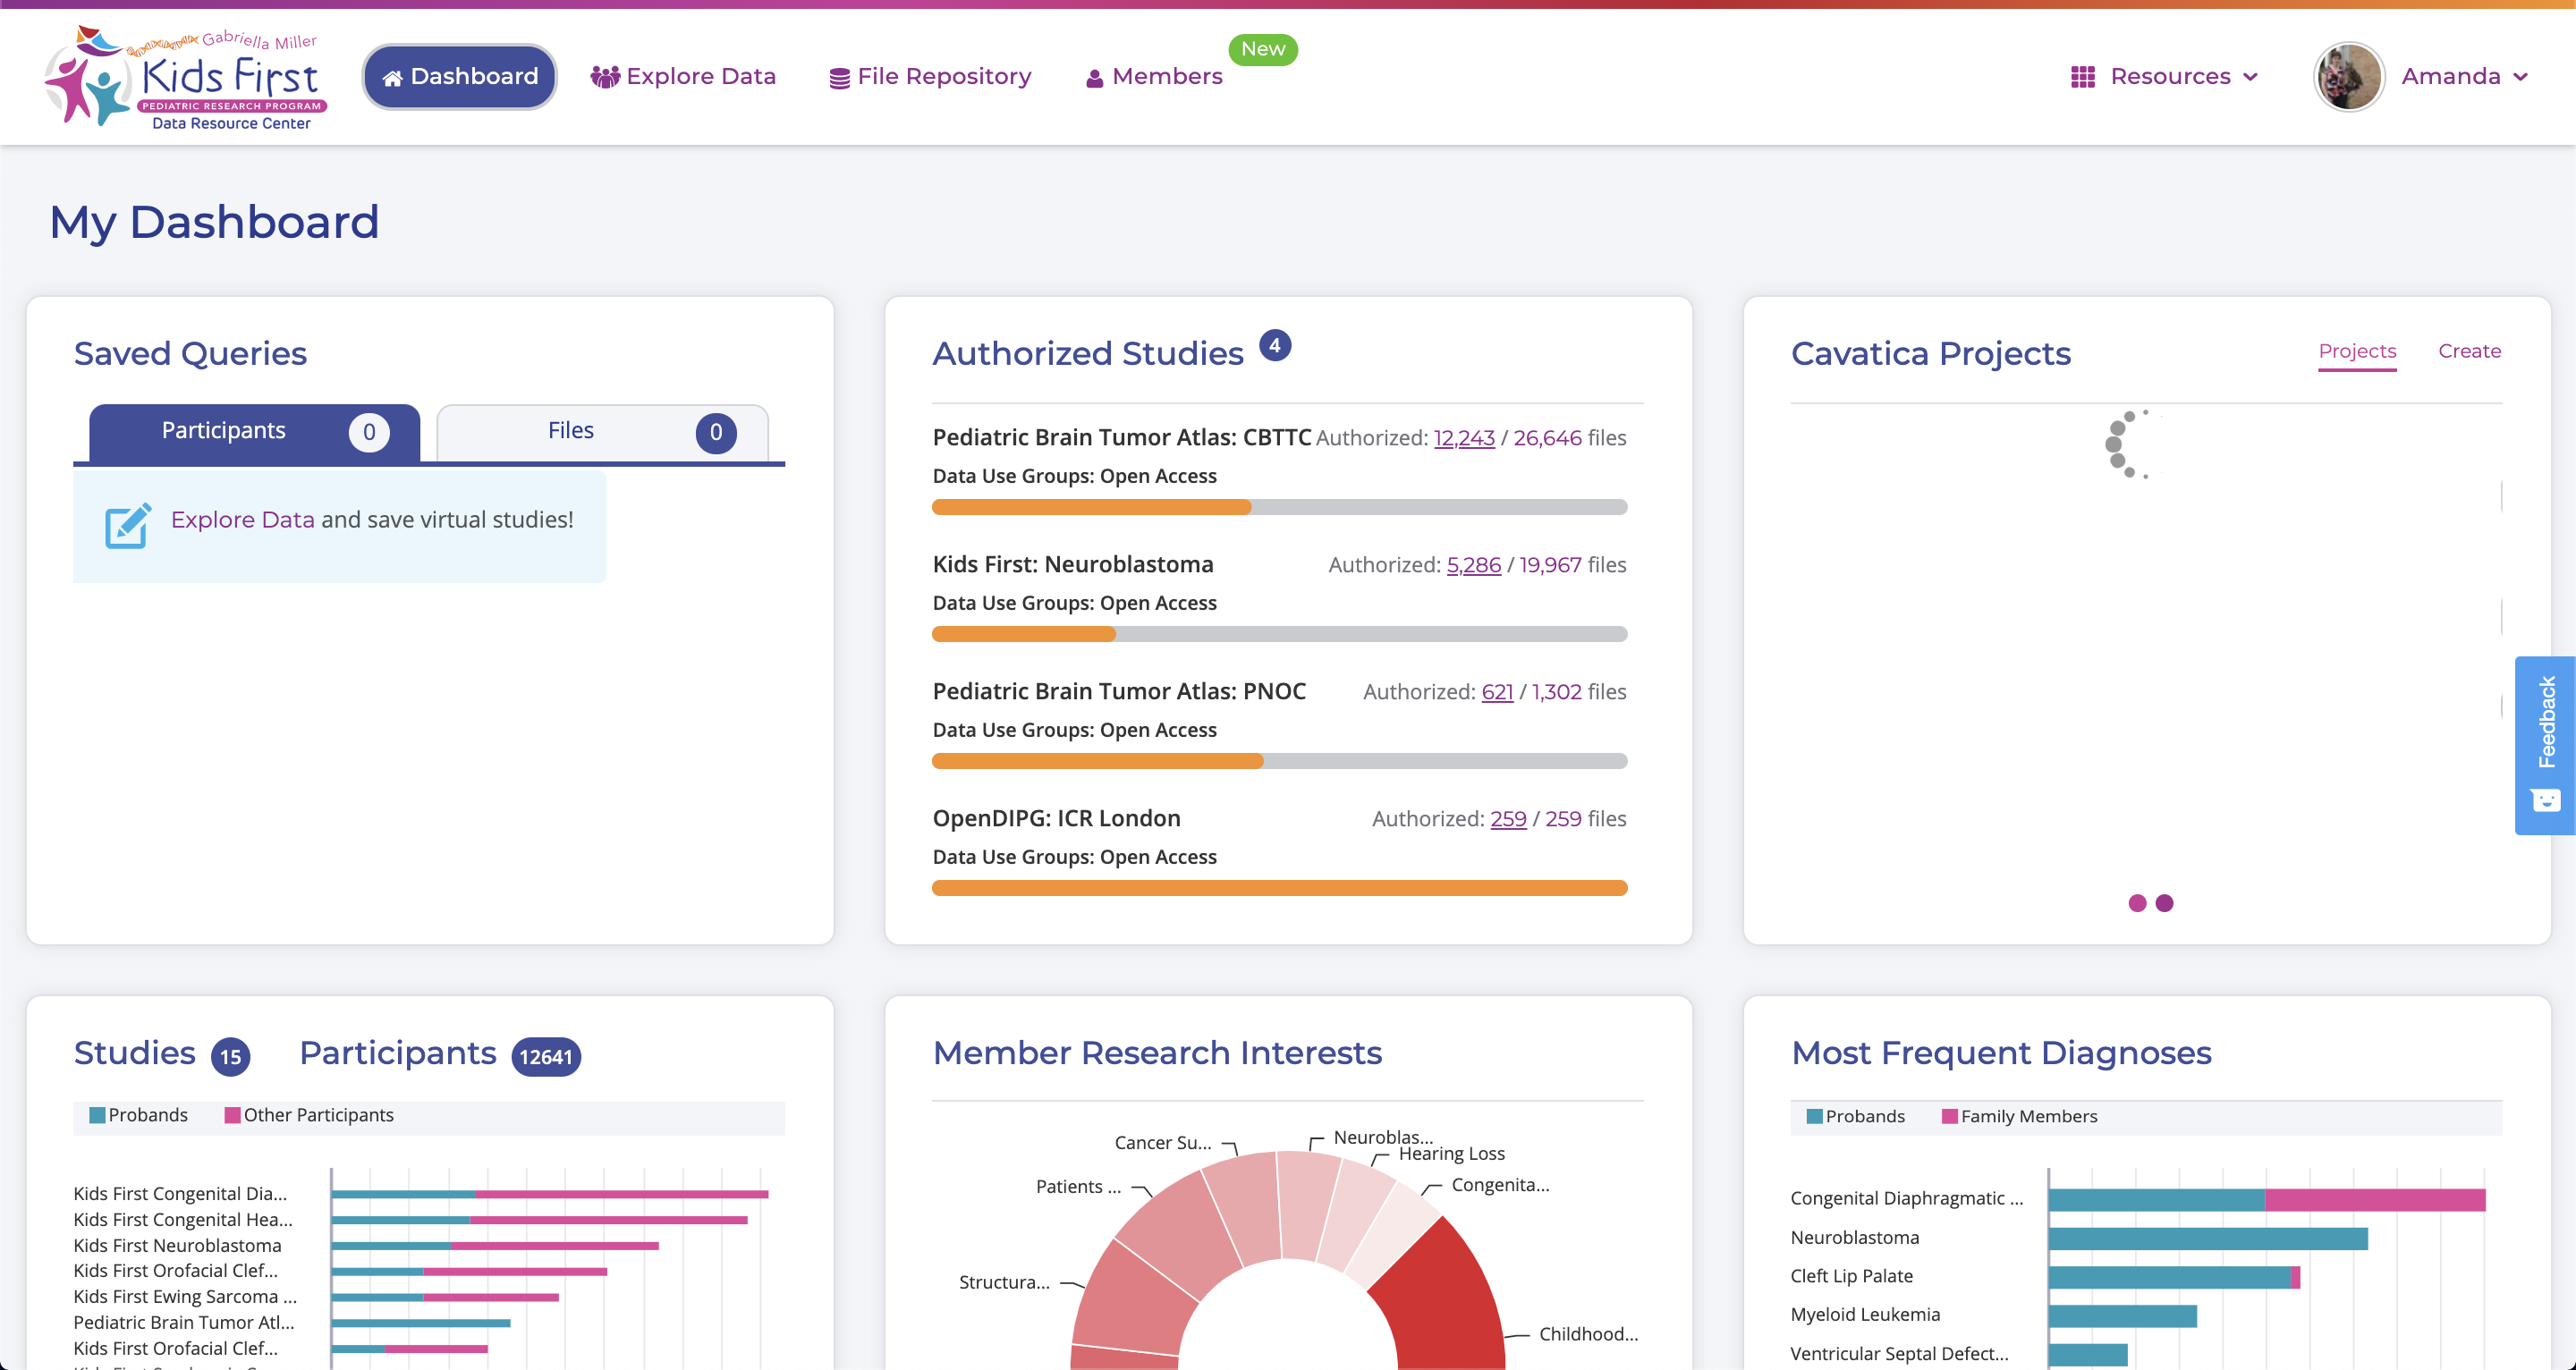
When you first log in, you will see this screen:

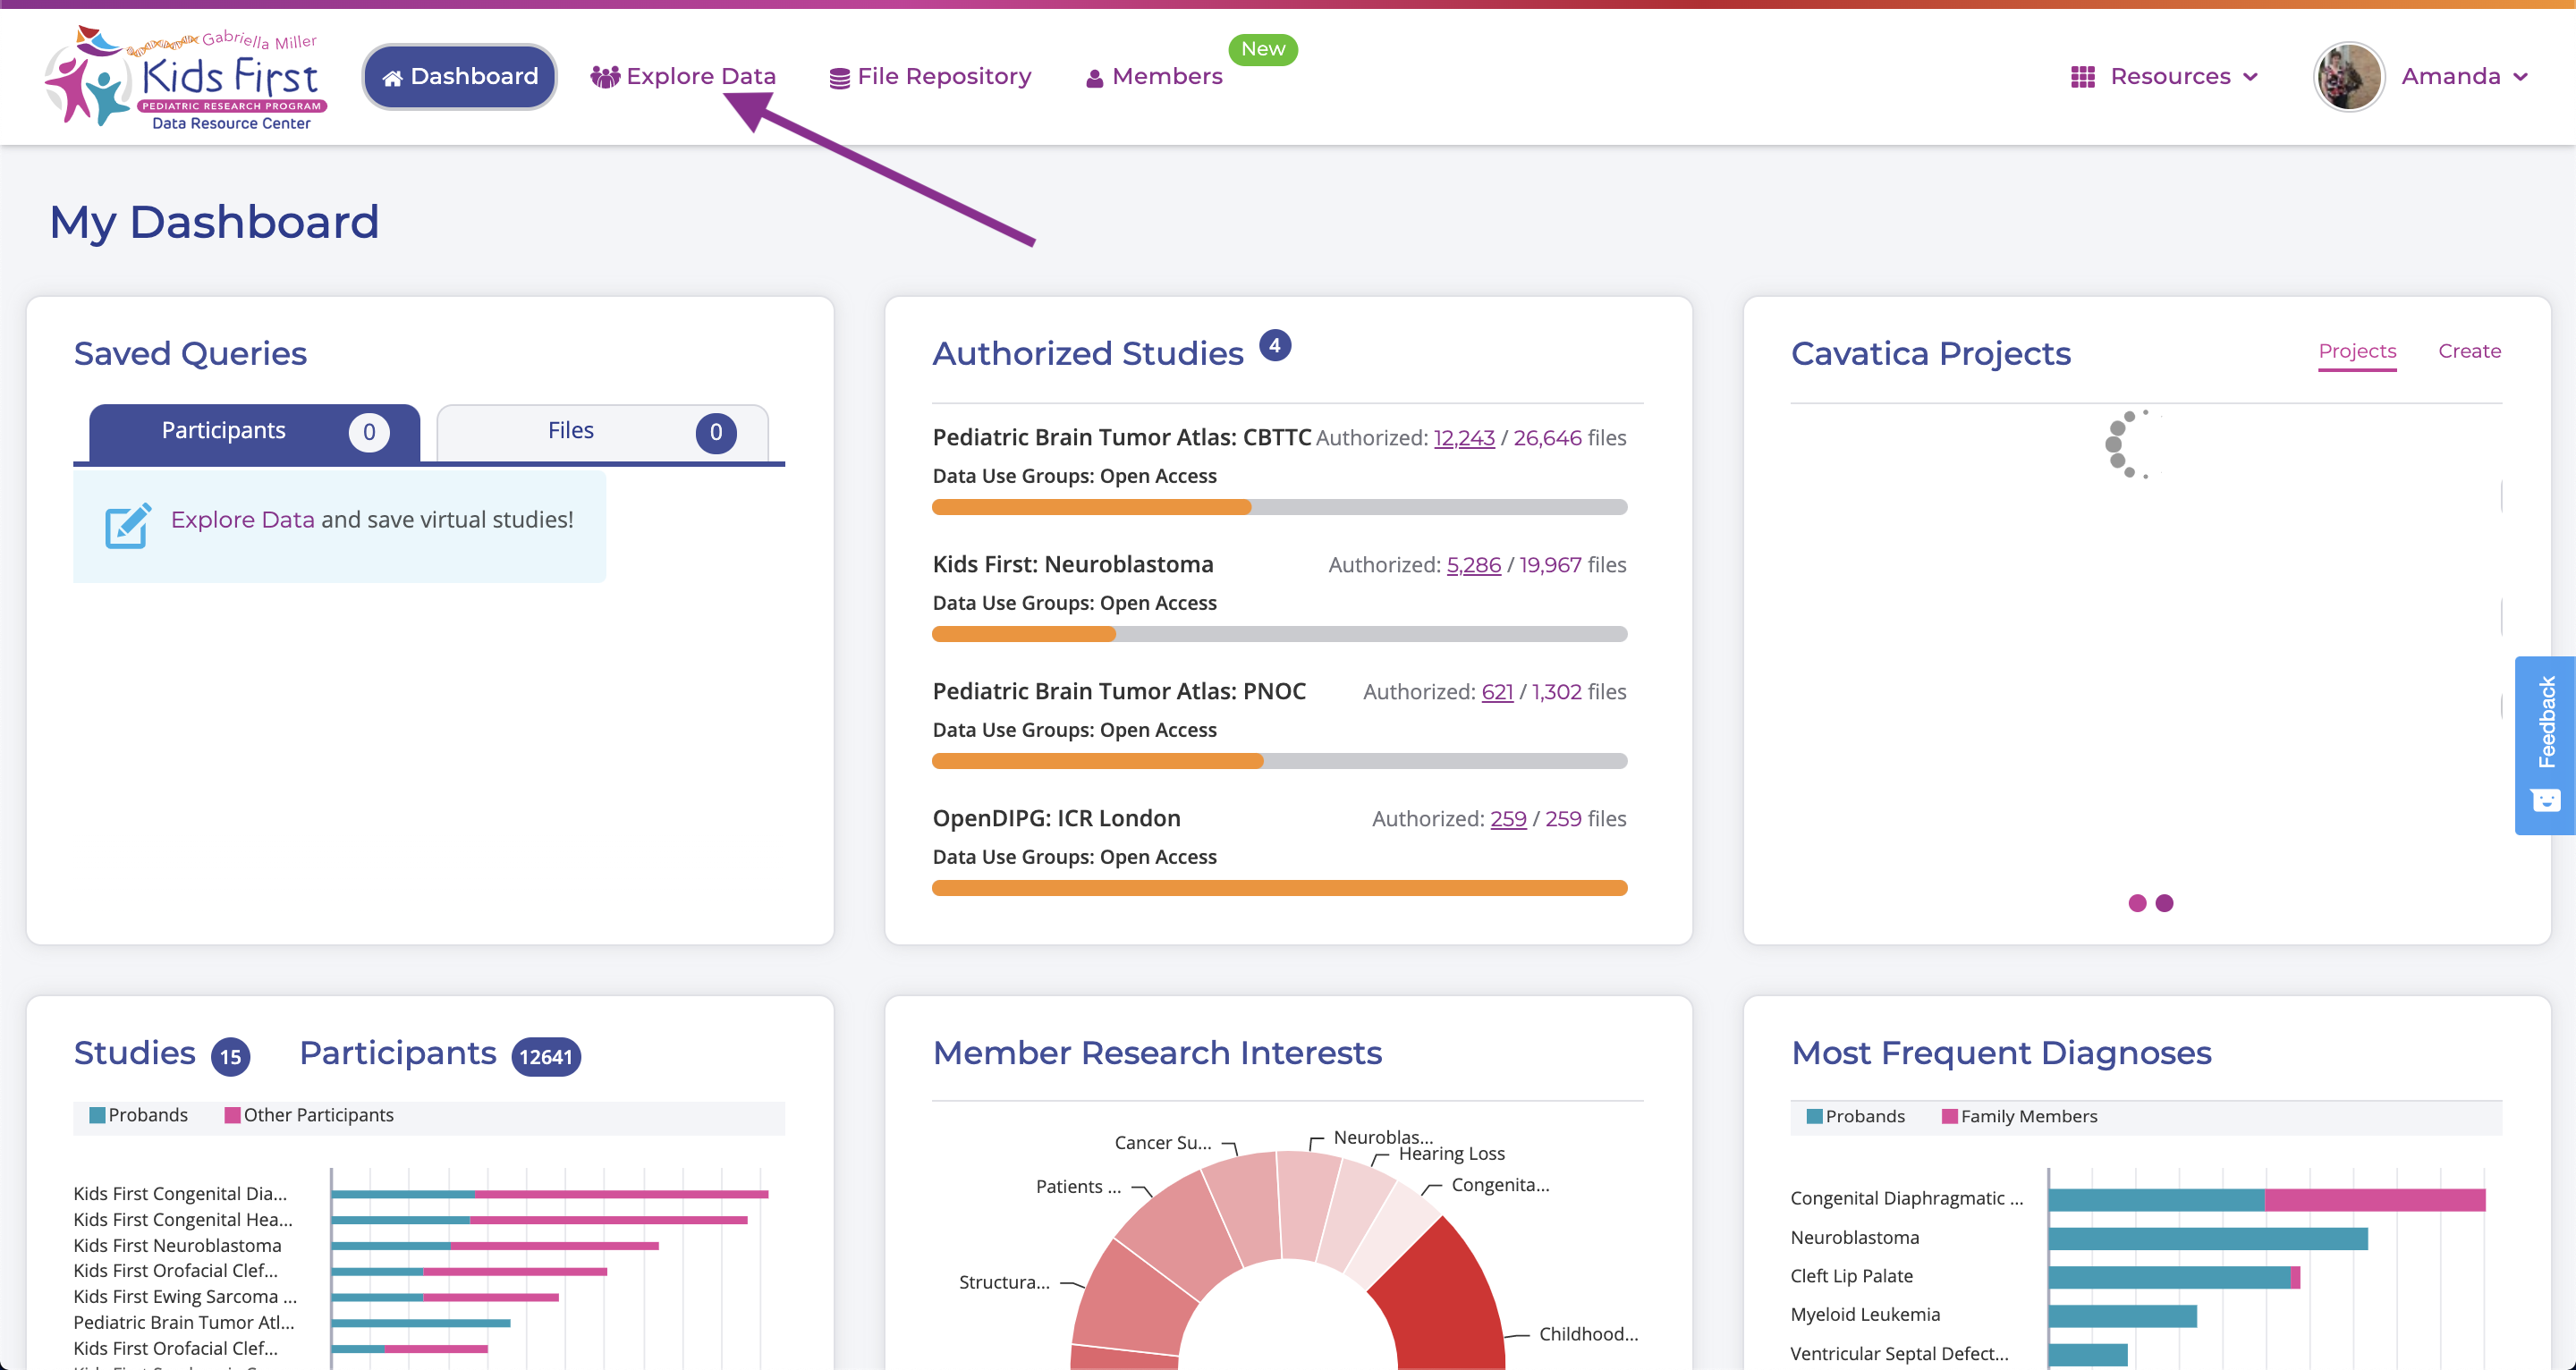
Step 2: Navigate to the Explore Data tab
Click on "Explore Data"

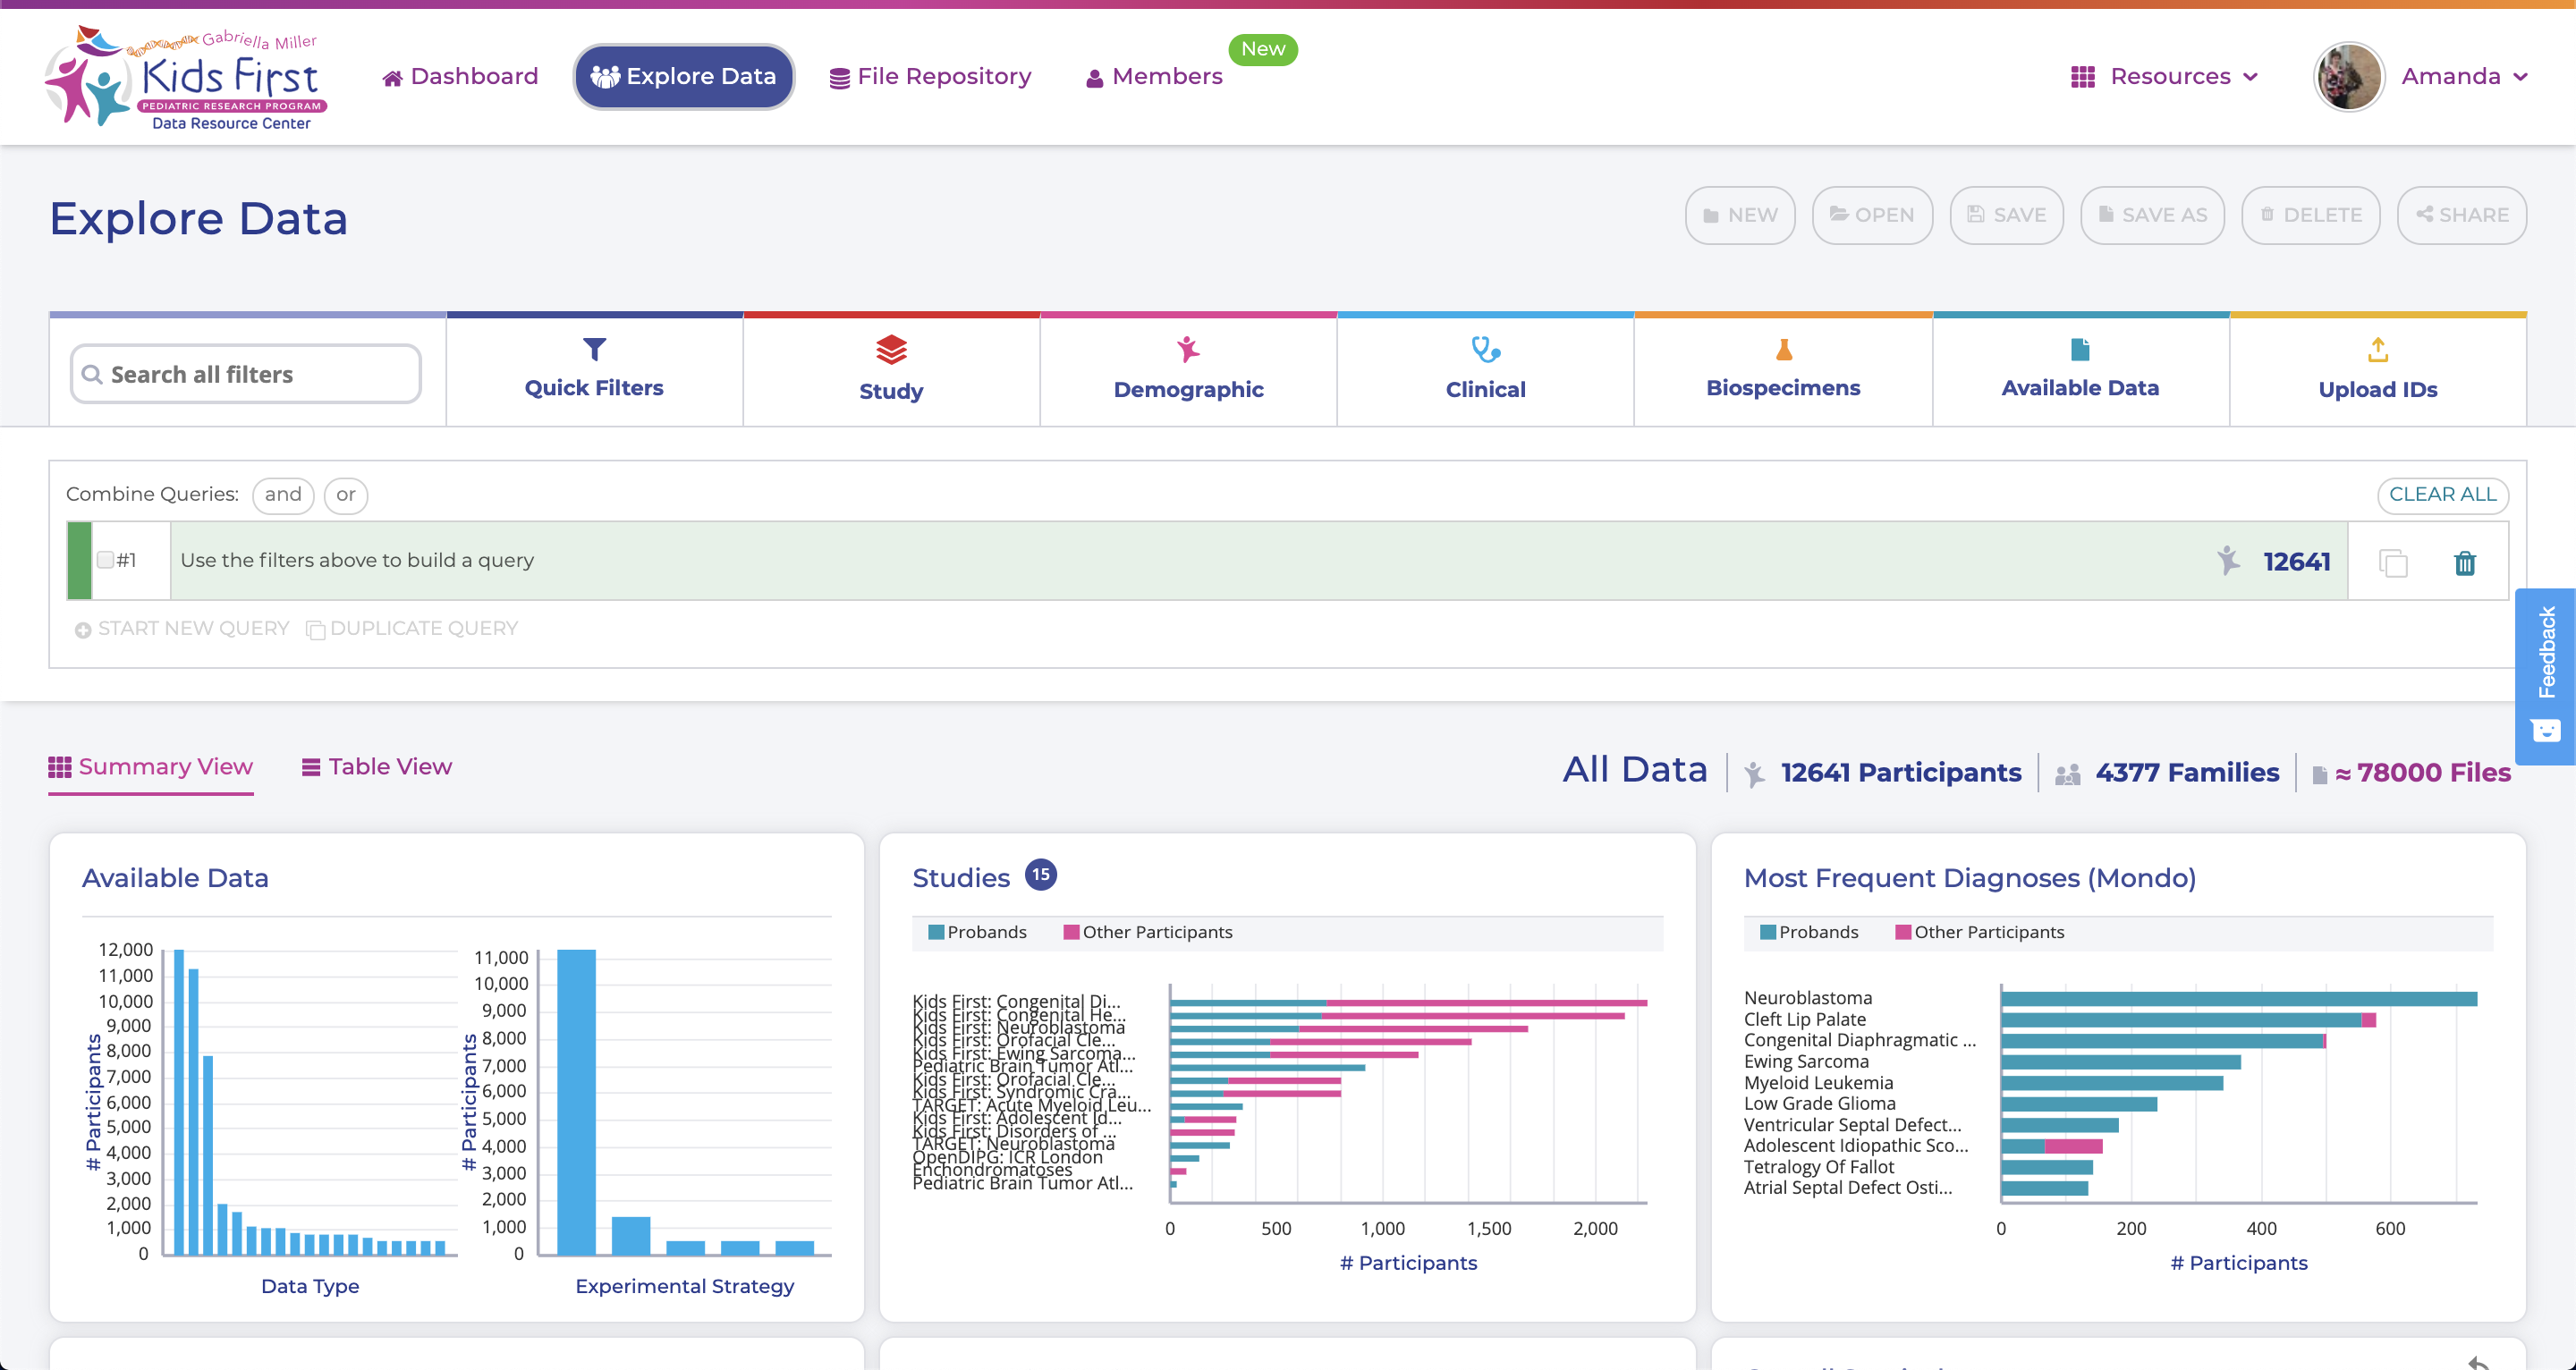
You should now be on a page that looks like this:

Exploring the Data
It is important to get a sense of what data exists before we start filtering down and designing an experiment. This page gives us a set of six interactive plots that display the overall data. You can impose filters on the data in two different ways:
- By using the filter buttons
- By clicking a graph component of any plot