Cavatica - View, Filter, Tag and Download
To view the project folder on Cavatica, you can click the link from the pop-up box in KF Portal after successfully copying files. This will will open the Cavatica login page. Alternatively, you can login to Cavatica in a new tab.
Step 1: View files in Cavatica 
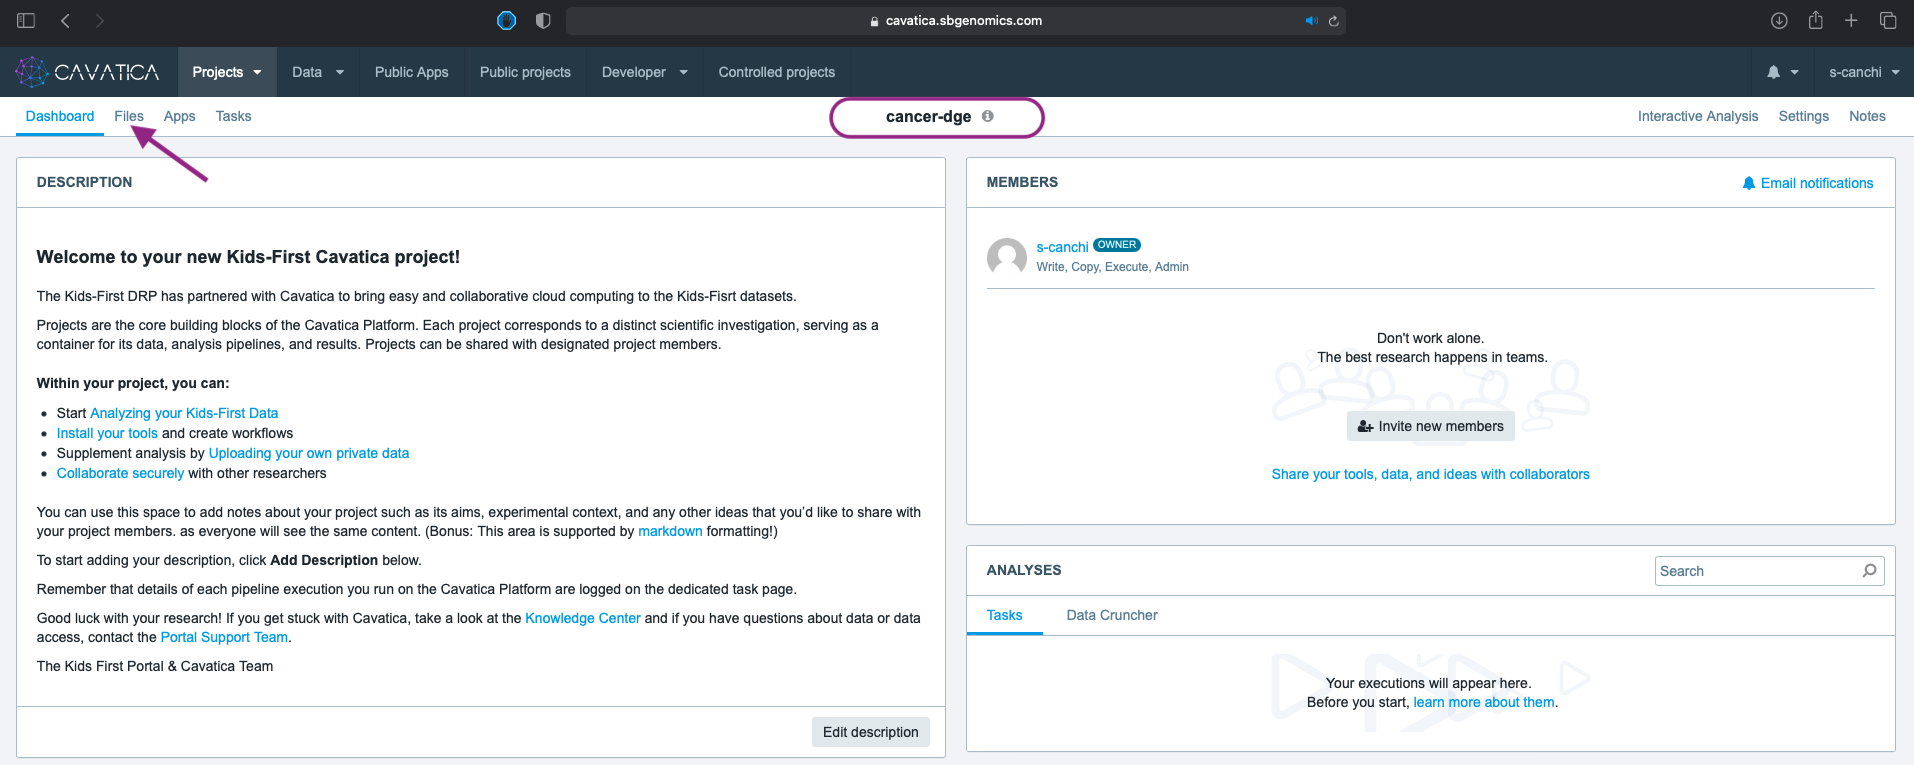
- Select the newly created project folder under the Projects tab.
- The Dashboard of the project folder has three panels: Description, Members and Analyses.
- Click on the Files tab to list all the project files.
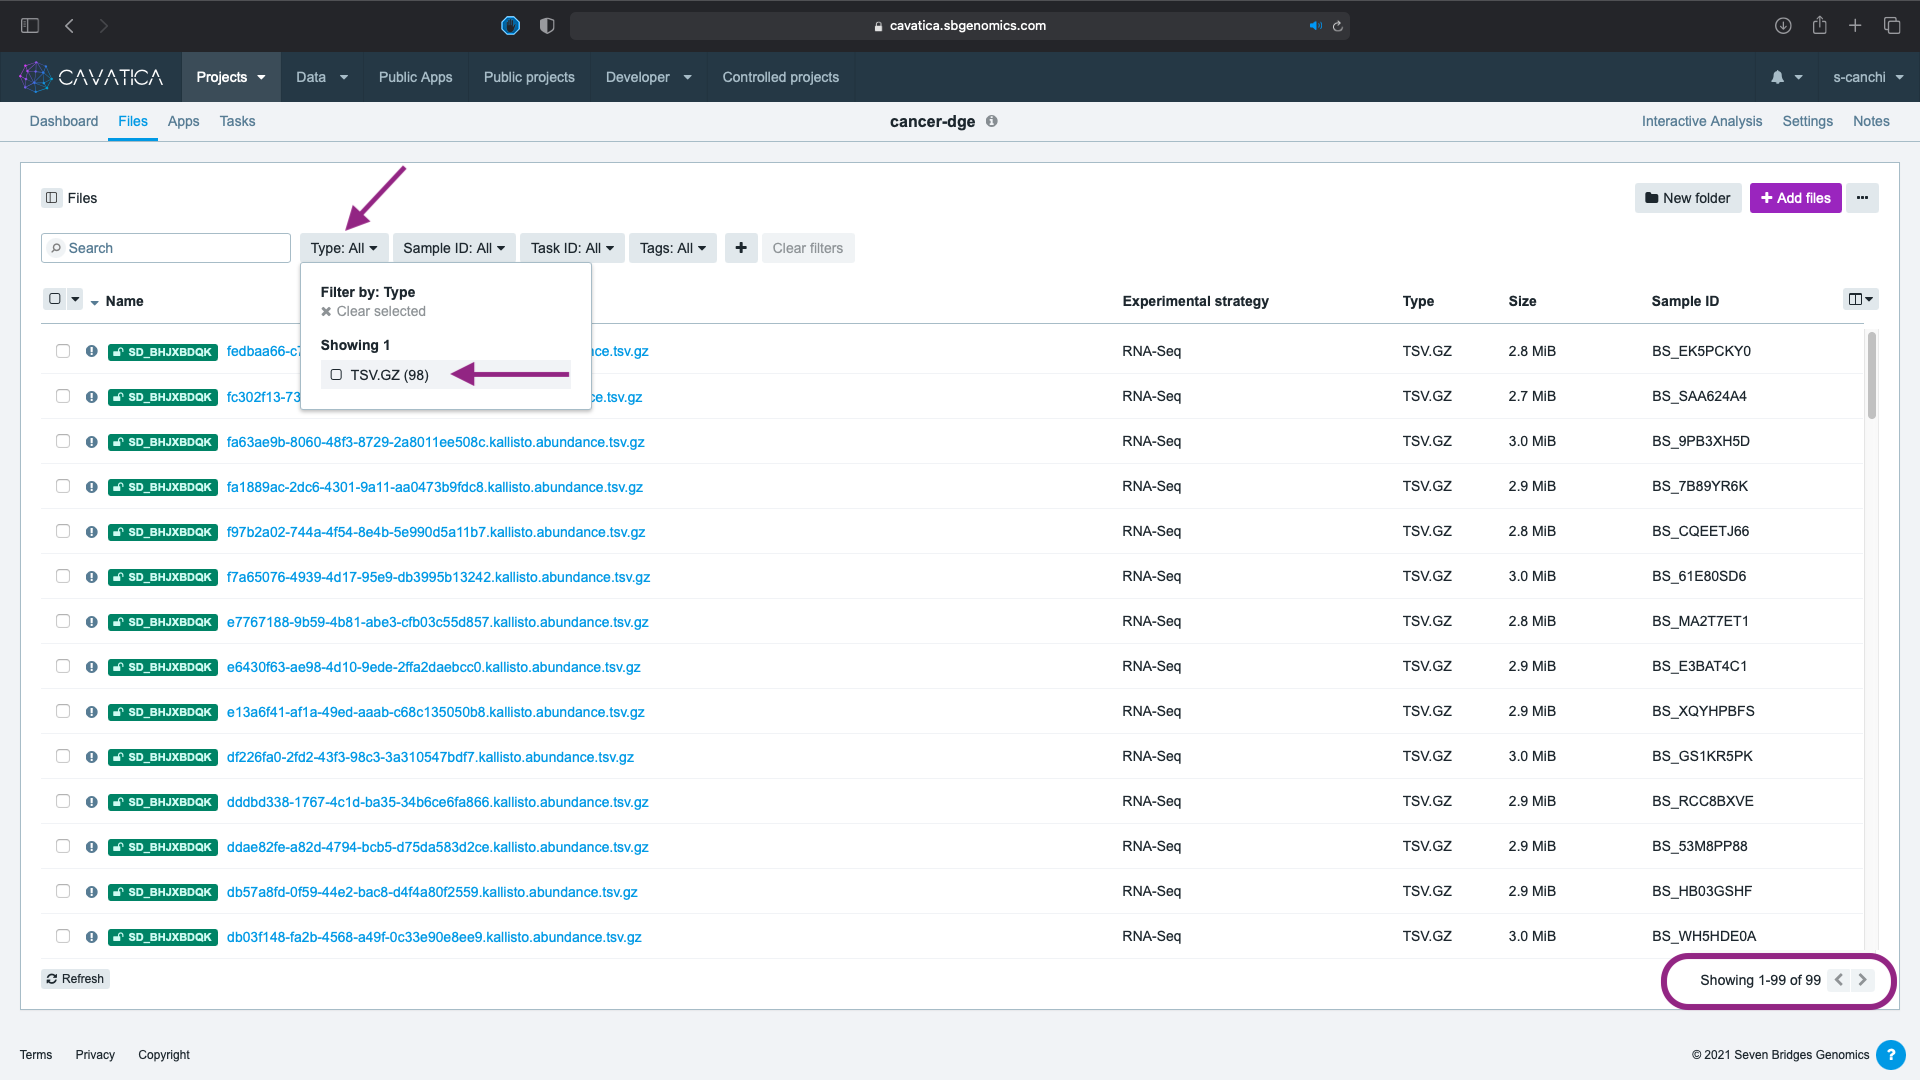
- Click on the Type: All filter for a drop down box which lists the type and number of files: 99 compressed tsv files.
Step 2: Apply filters to subset cohort
Before we proceed to the Differential Gene Expression Analysis (DGE analysis), it is a good idea to examine the metadata associated with our selected cohort. Because we aim to keep the experimental design simple, we will further filter down to remove possible sources of variation.
The columns visible in the table are the platform default options. Click on on the right hand corner and select any columns to view from the metadata list.
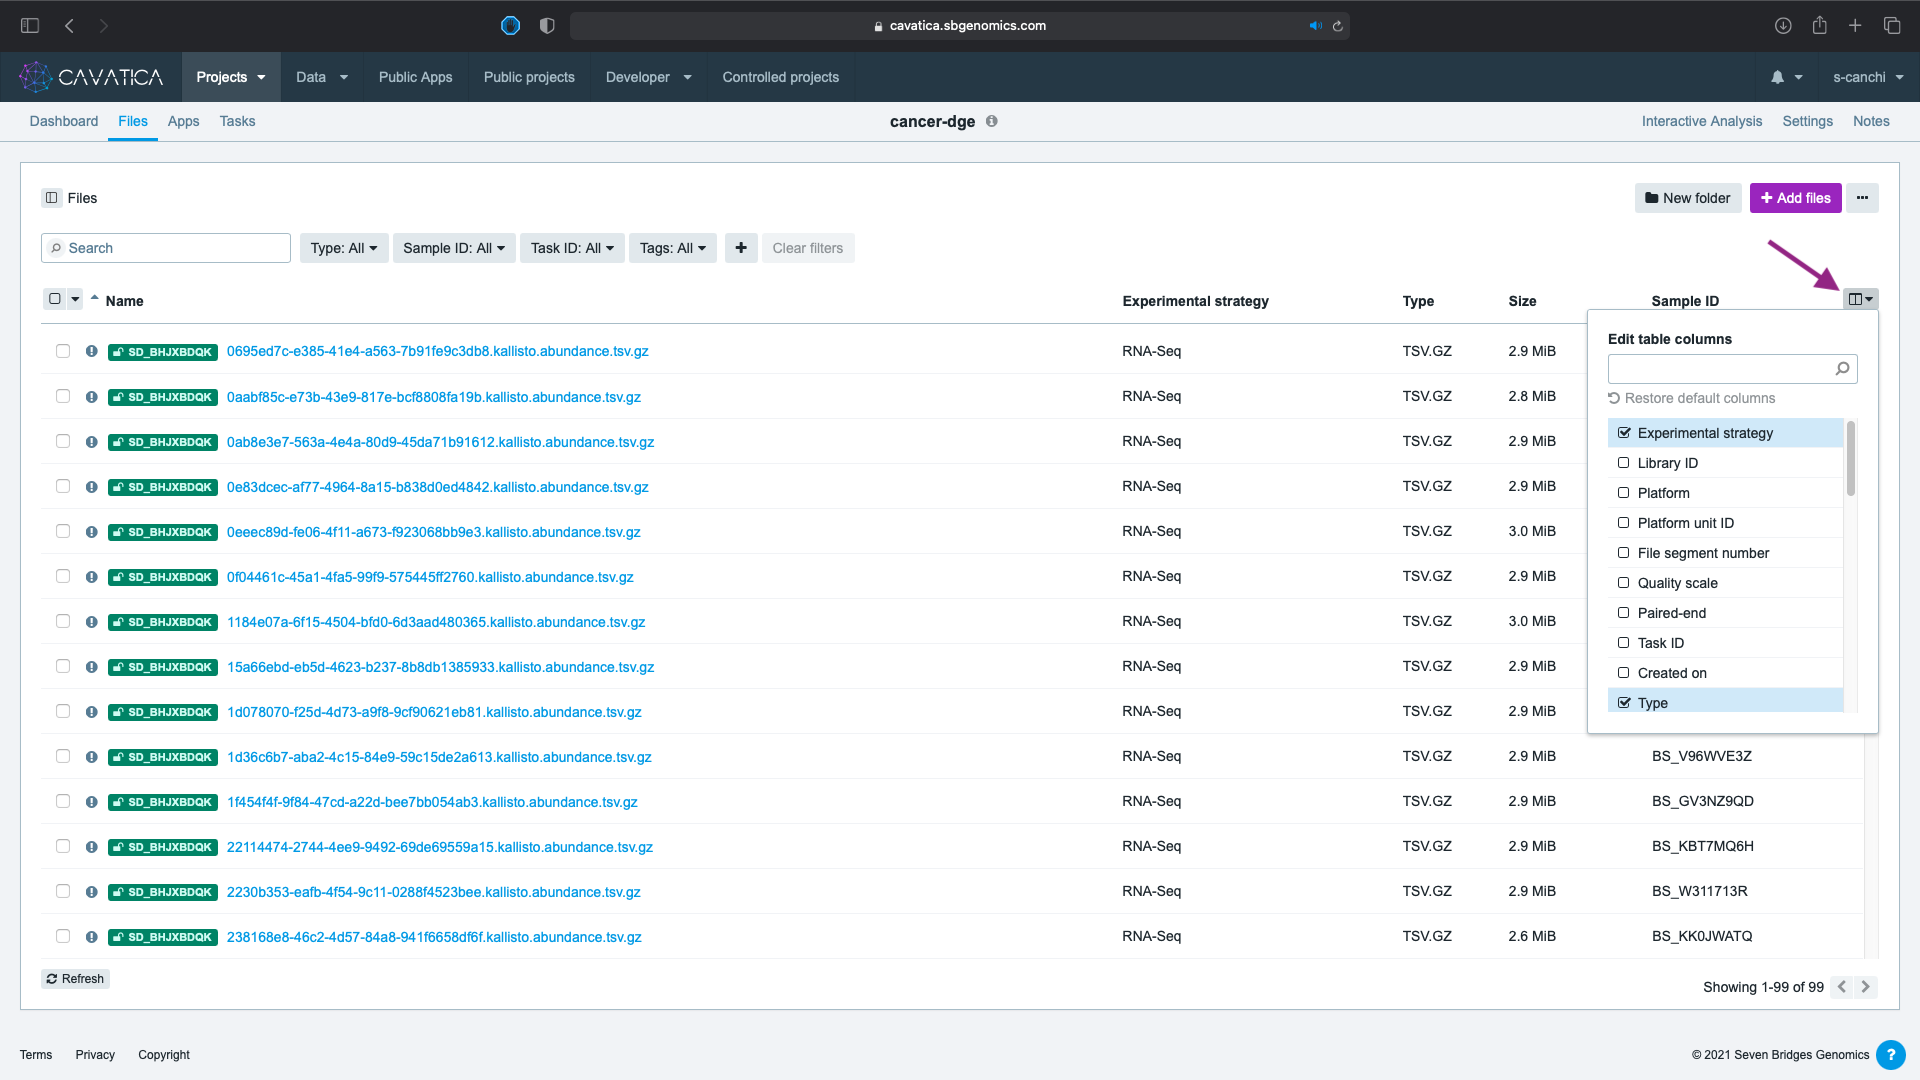
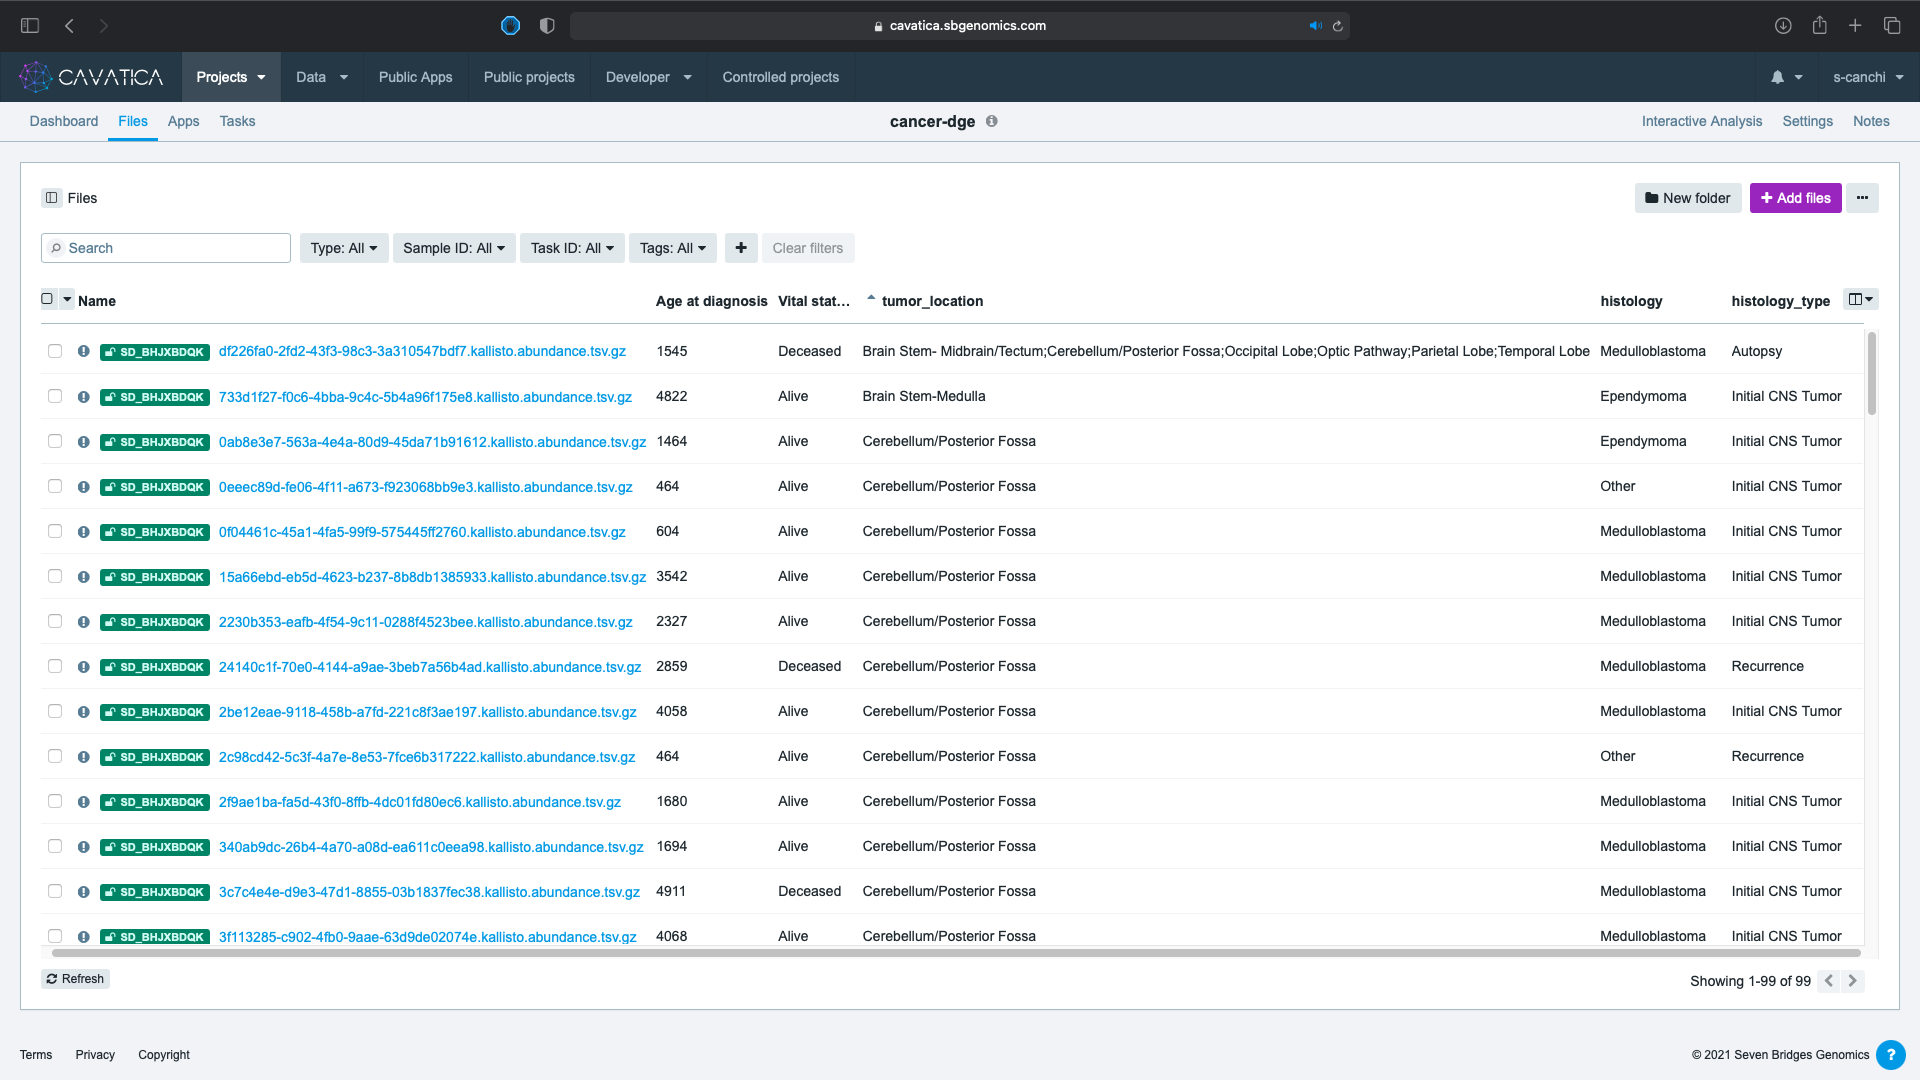
Here we have selected:
- Age at diagnosis
- Vital status
- tumor_location
- histology
- histology_type
Age at diagnosis
The default unit for any age metadata field is recorded in days and is reflected in the large numeric values for Age at diagnosis column.
Each of these columns have multiple values. To filter the data using values within multiple metadata columns, use the sign to add a filter. If you cannot see the button, refresh your browser, as your session may have timed out.

- First, we filter to only include surviving patients. Click on and choose Vital status, then select Alive from the sub-menu.

- Because the patients may have presented with multiple cancers over diagnostic timeline, the histology metadata has other values in addition to the cancer types of interest. Click again this time choosing histology and selecting both Medulloblastoma & Ependymoma.
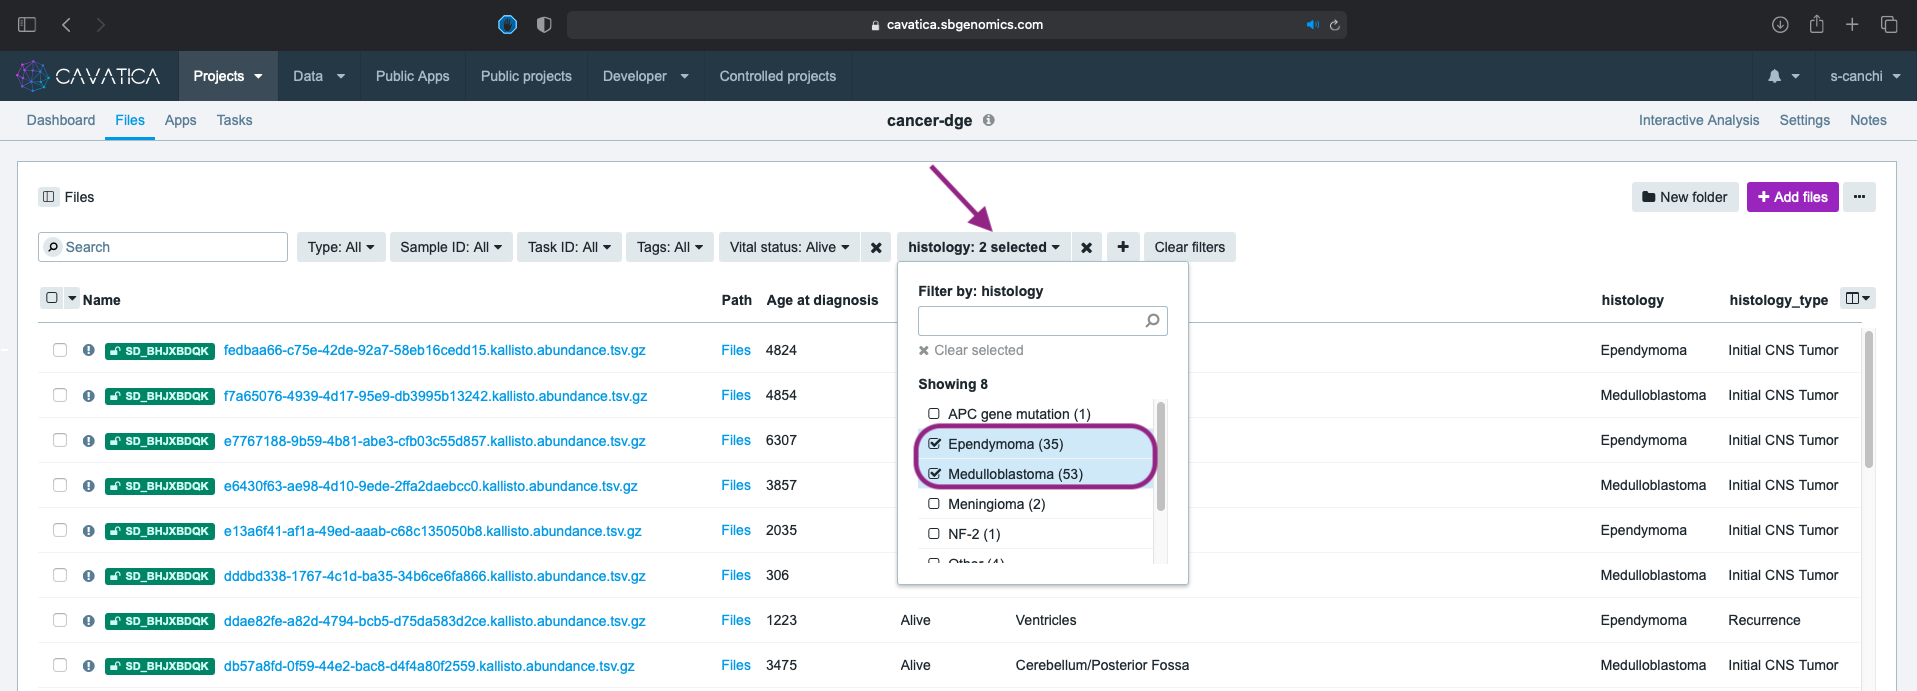
- To ensure comparison of cancer from the first presentation in the patient, we eliminate recurrent or progressive subtypes using the histology_type filter following the same steps as previously. This time select only Initial CNS Tumor.
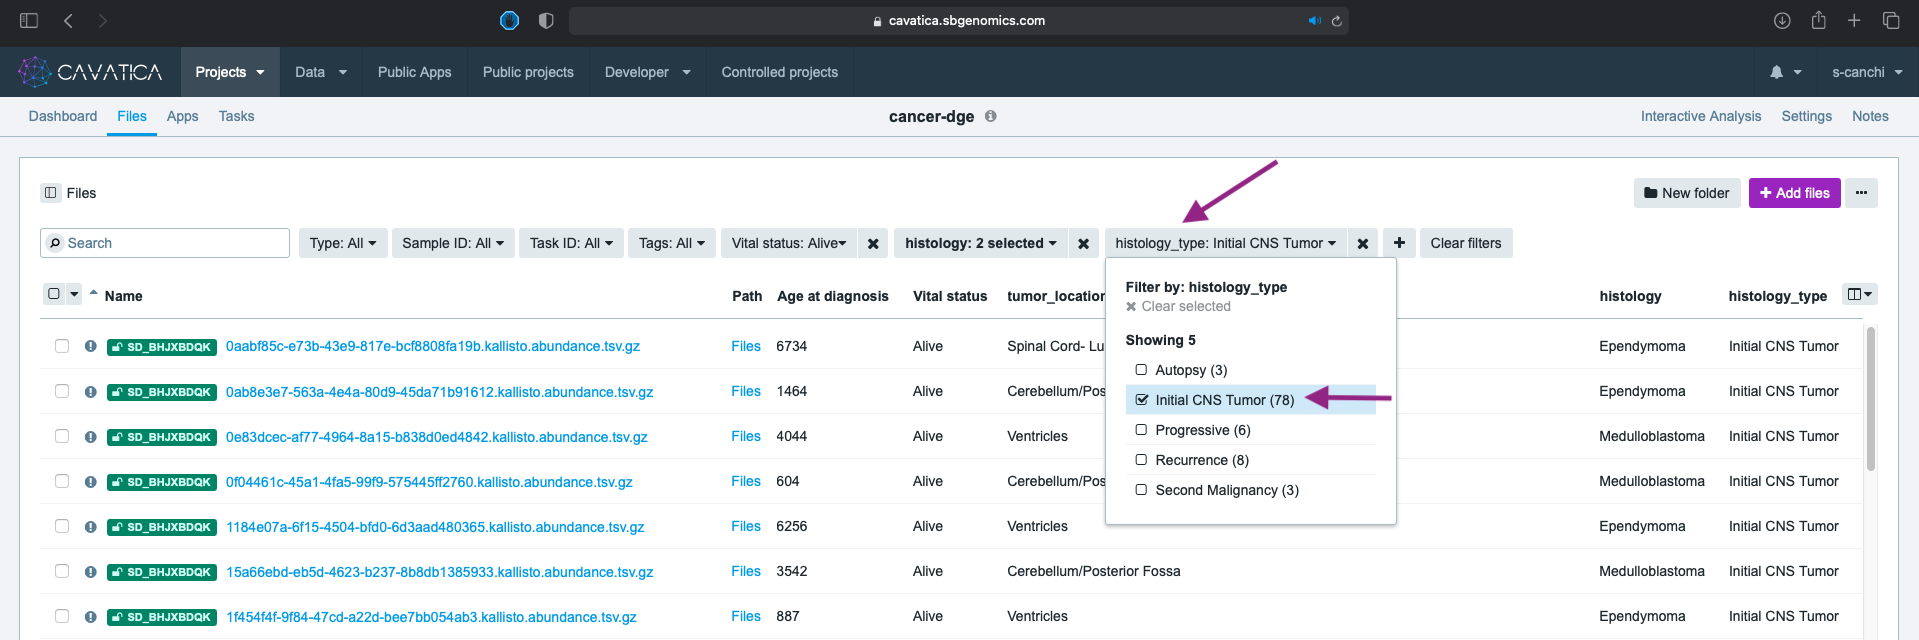
The tumor_location metadata column has some values that include multiple anatomically distinct locations separated by a ;. This could indicate the observation of spread of tumor to multiple locations during first occurrence.
- We filter using the tumor_location metadata, choosing only values without the
;. Select the eleven distinct values fortumor_location(not including those with;,Not Reported, andOther locations NOS). You can see the complete list in the screen capture below.
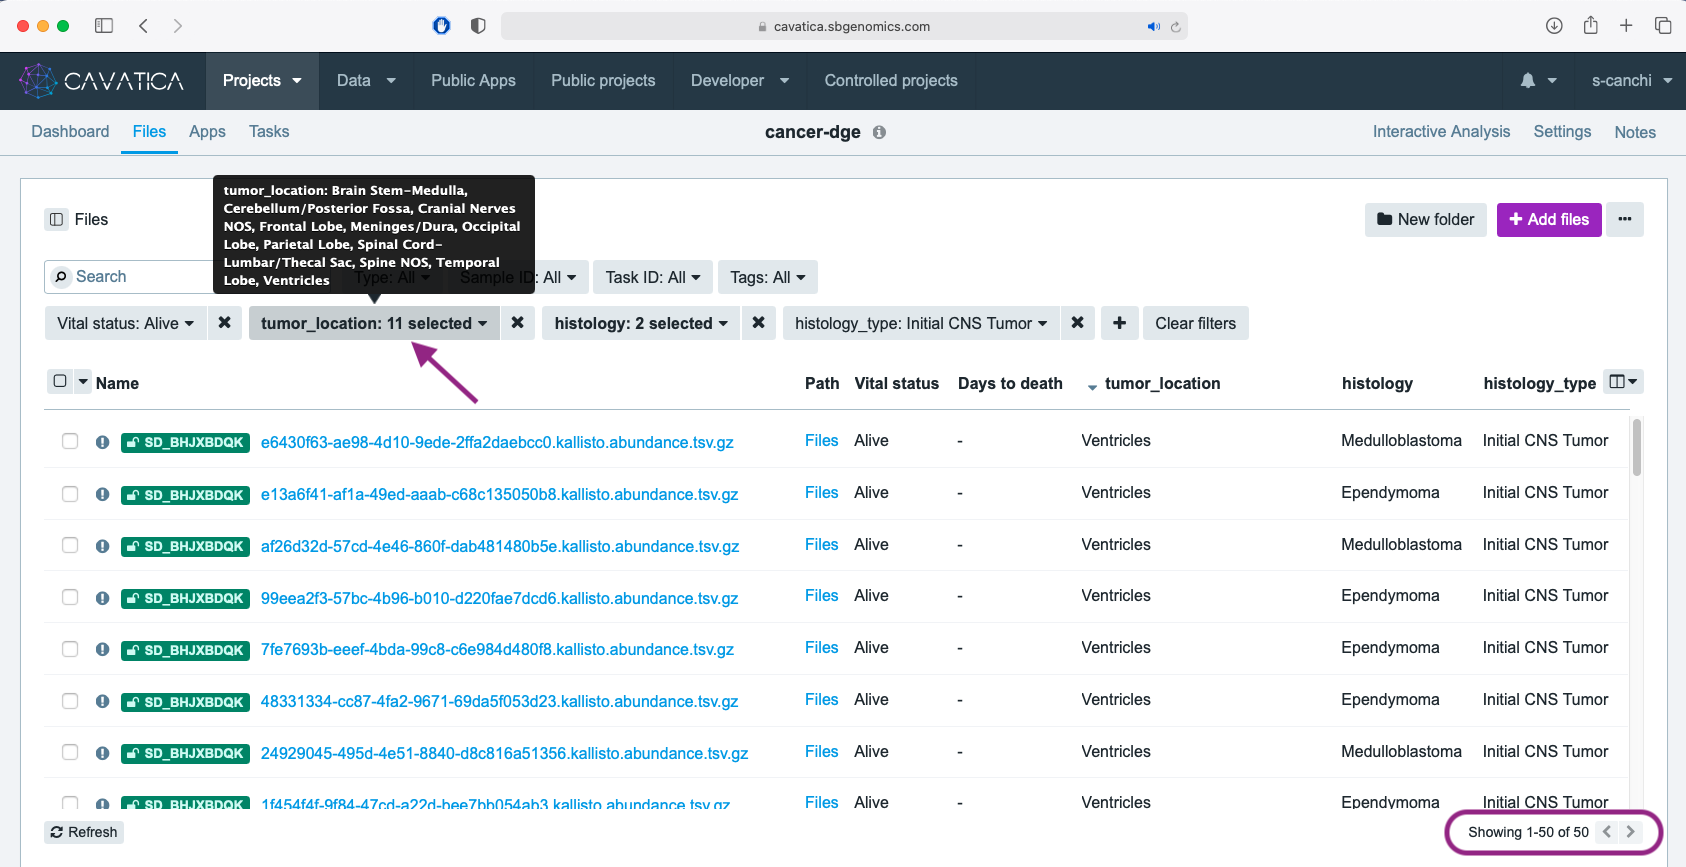
This results in total of 50 files from our initial 99 copied files.
Step 3: Create tags & download filtered dataset
To enable quick access to the filtered data without having to re-run all the metadata filters, we can create a tag for these filtered data files.
- Select all the files by clicking on in the column header and click on Tags tab.
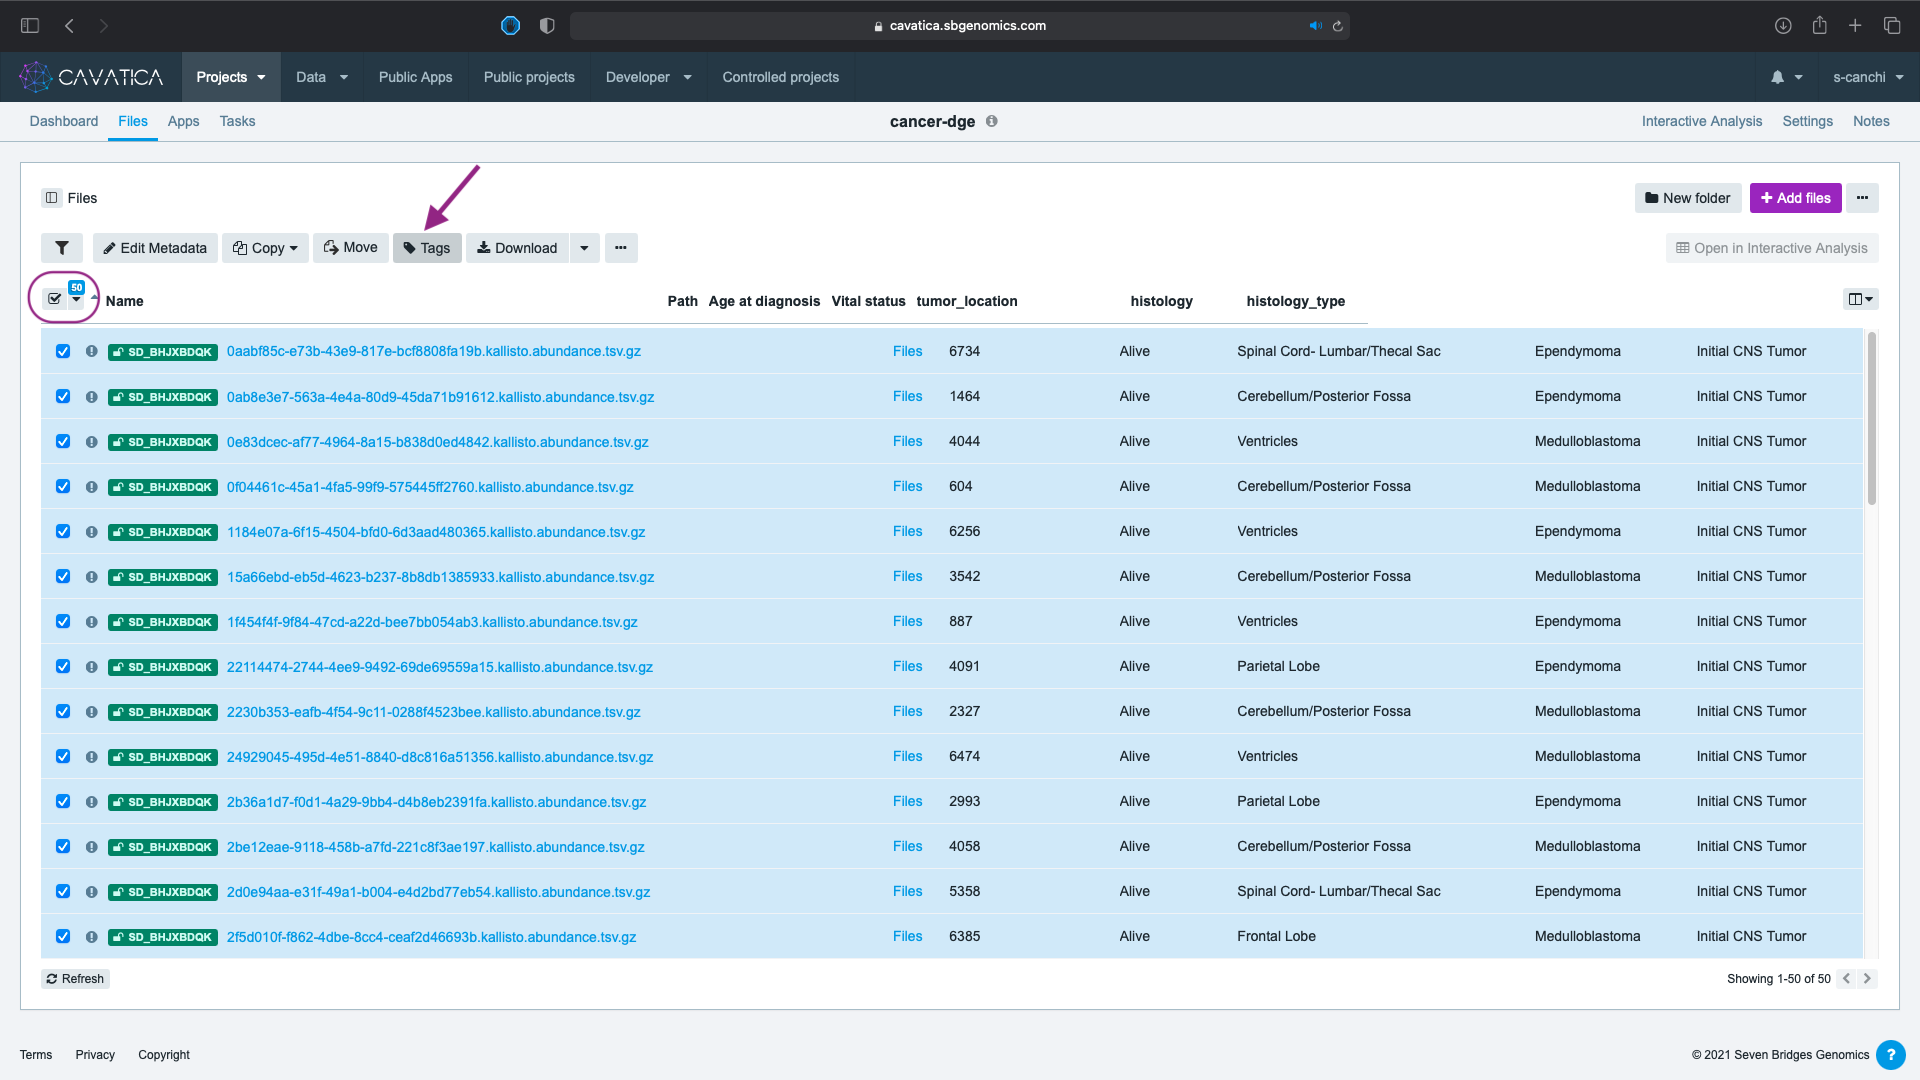
- Type the name of the tag and click Add new tag.
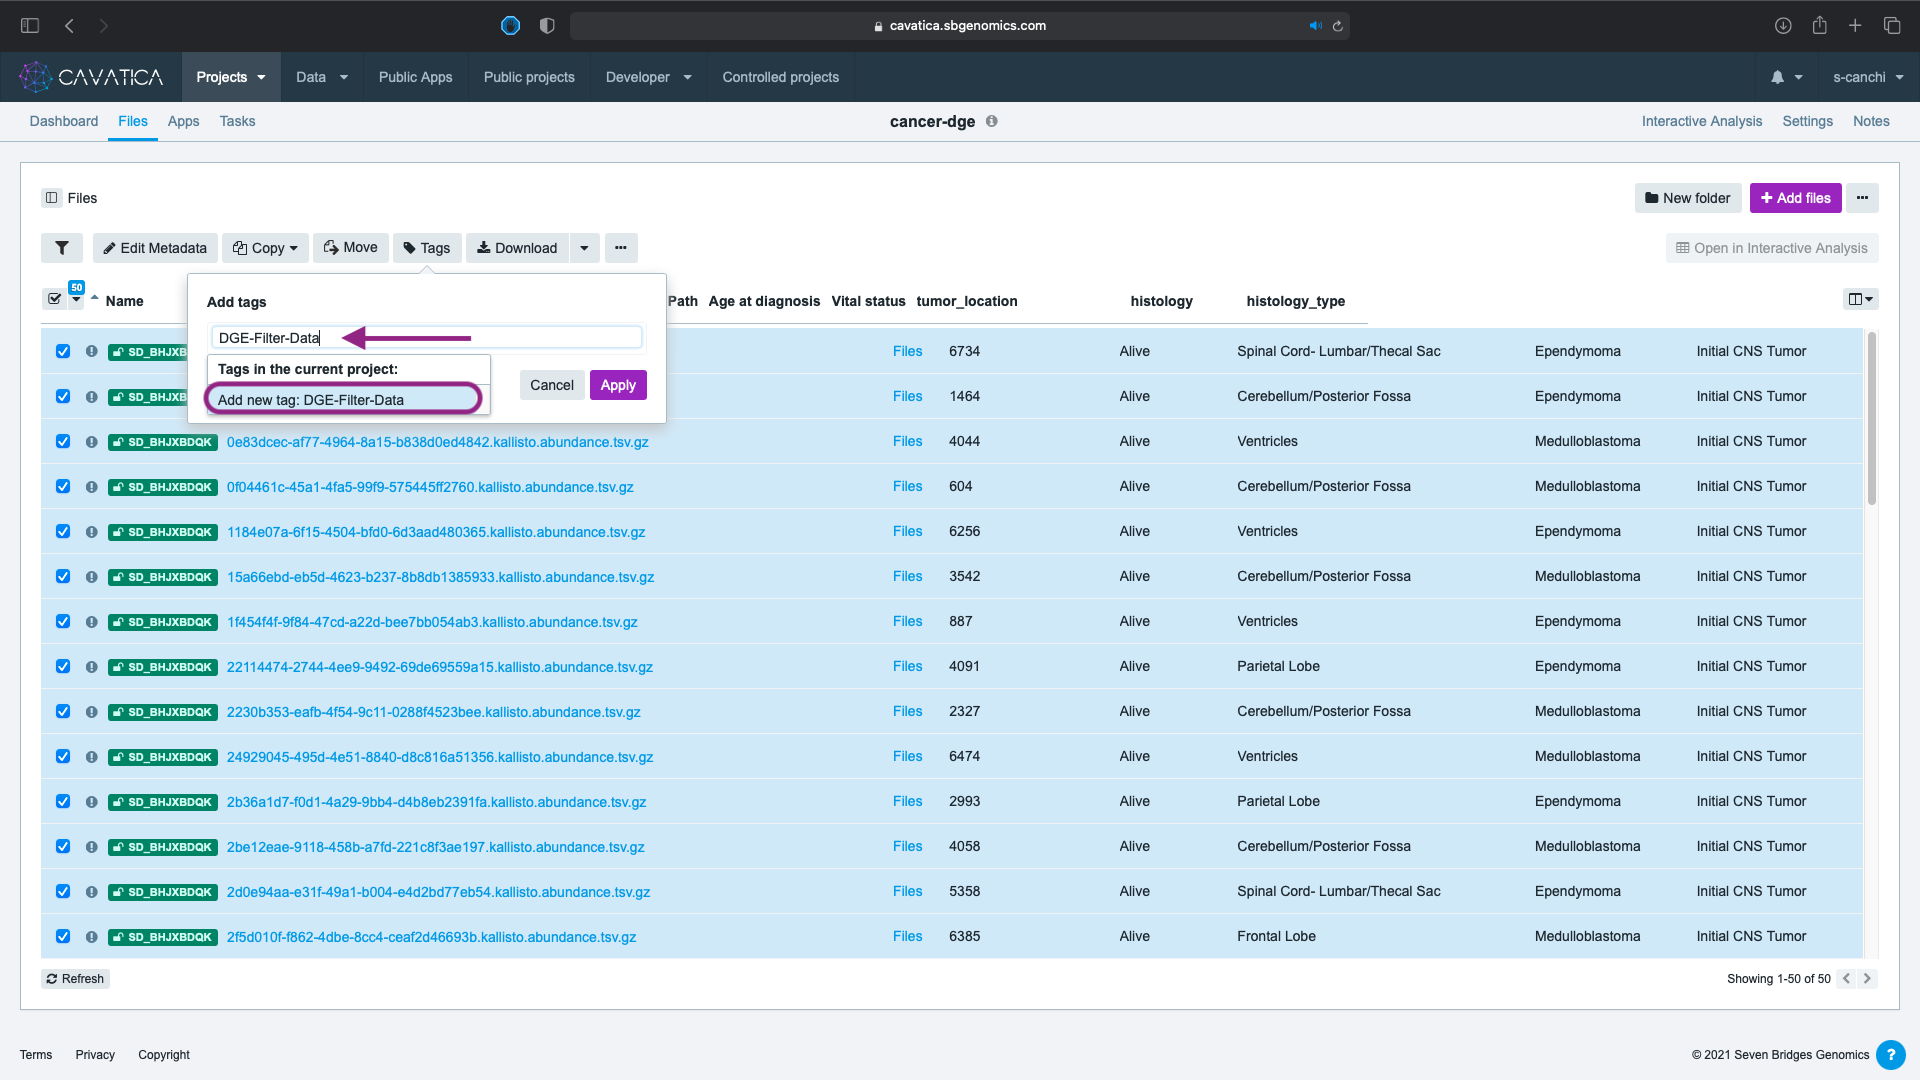
Tag Names
You can use any tag name you choose. In this lesson and in the screenshots, we use DGE-FILTER-DATA.
- Click Apply. In case, you wish to remove the tag, use the in the tag name to delete.
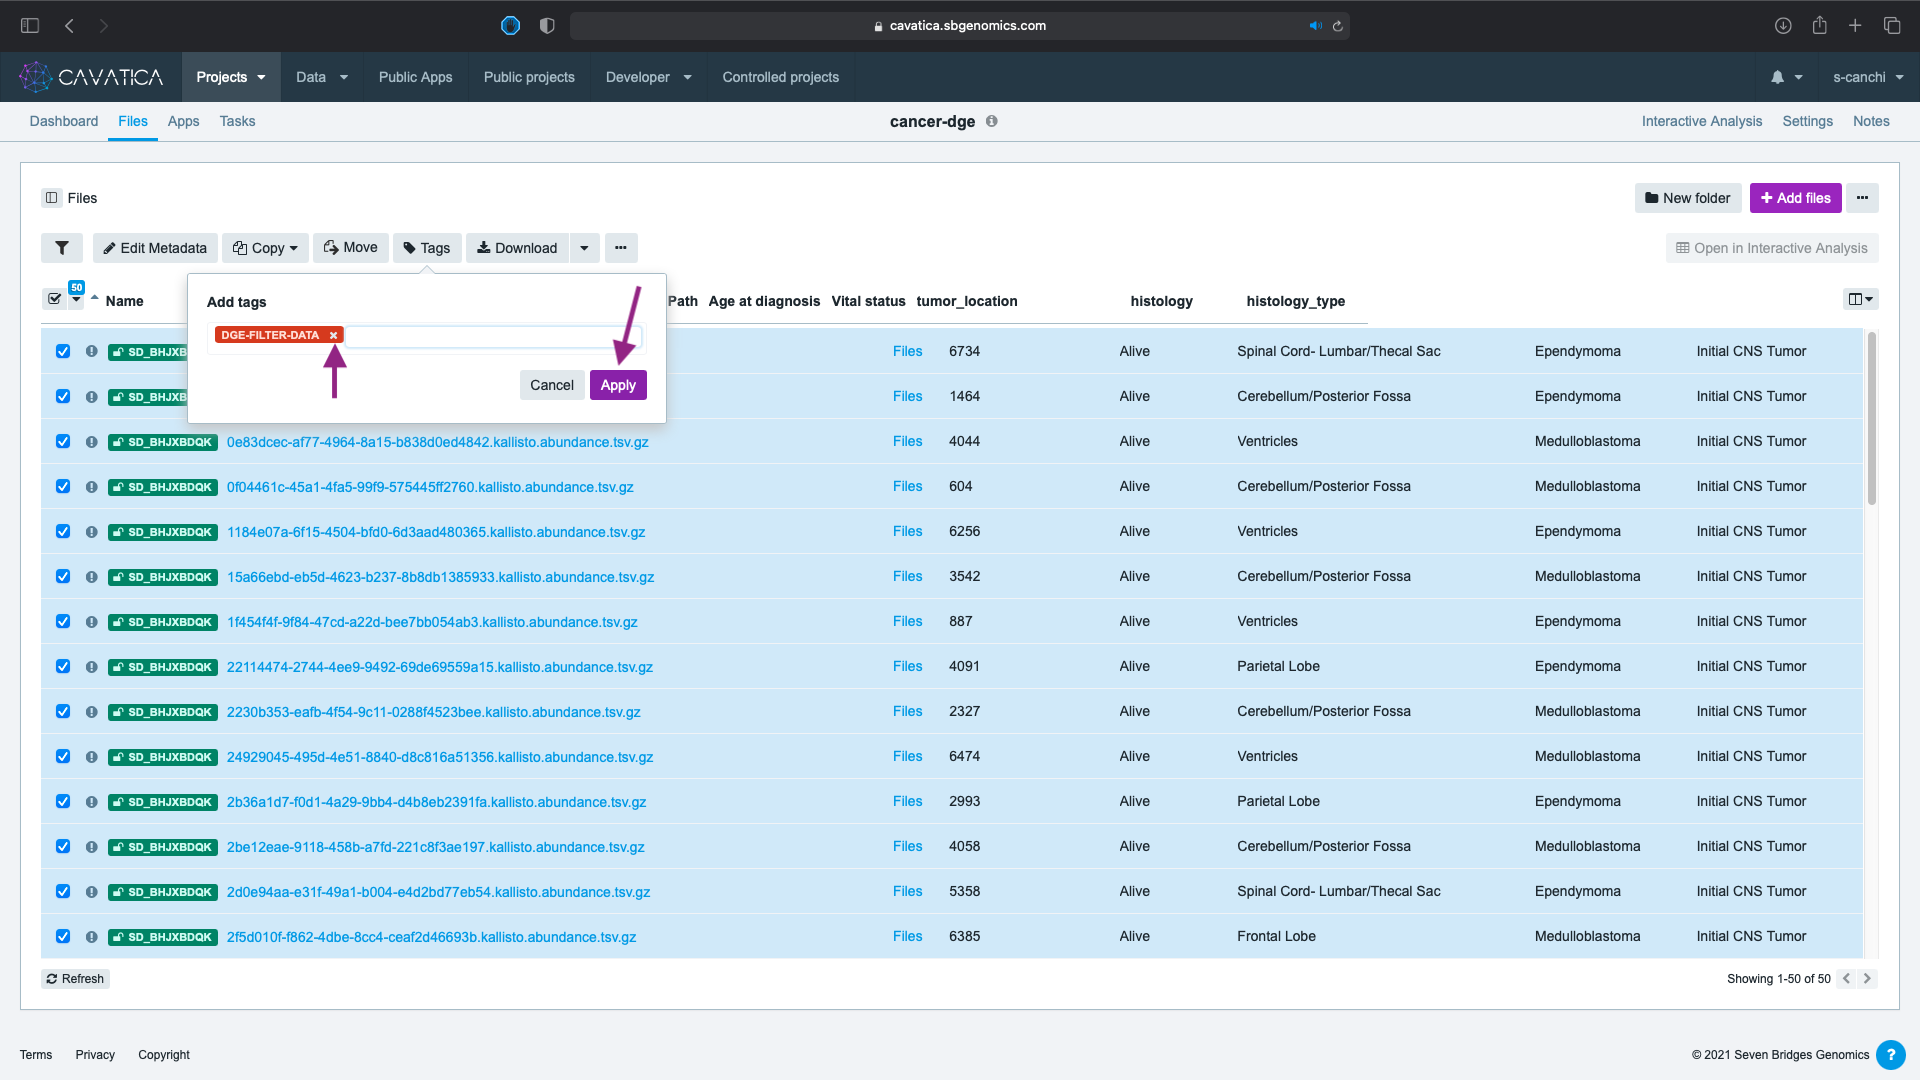
The filtered files are now tagged. We need to download and modify the metadata file which will be used as the accompanying phenotype file for our DGE analysis in the next lesson. To download:
- Click on the button on the right corner.
- Select Export metadata manifest from filtered files.
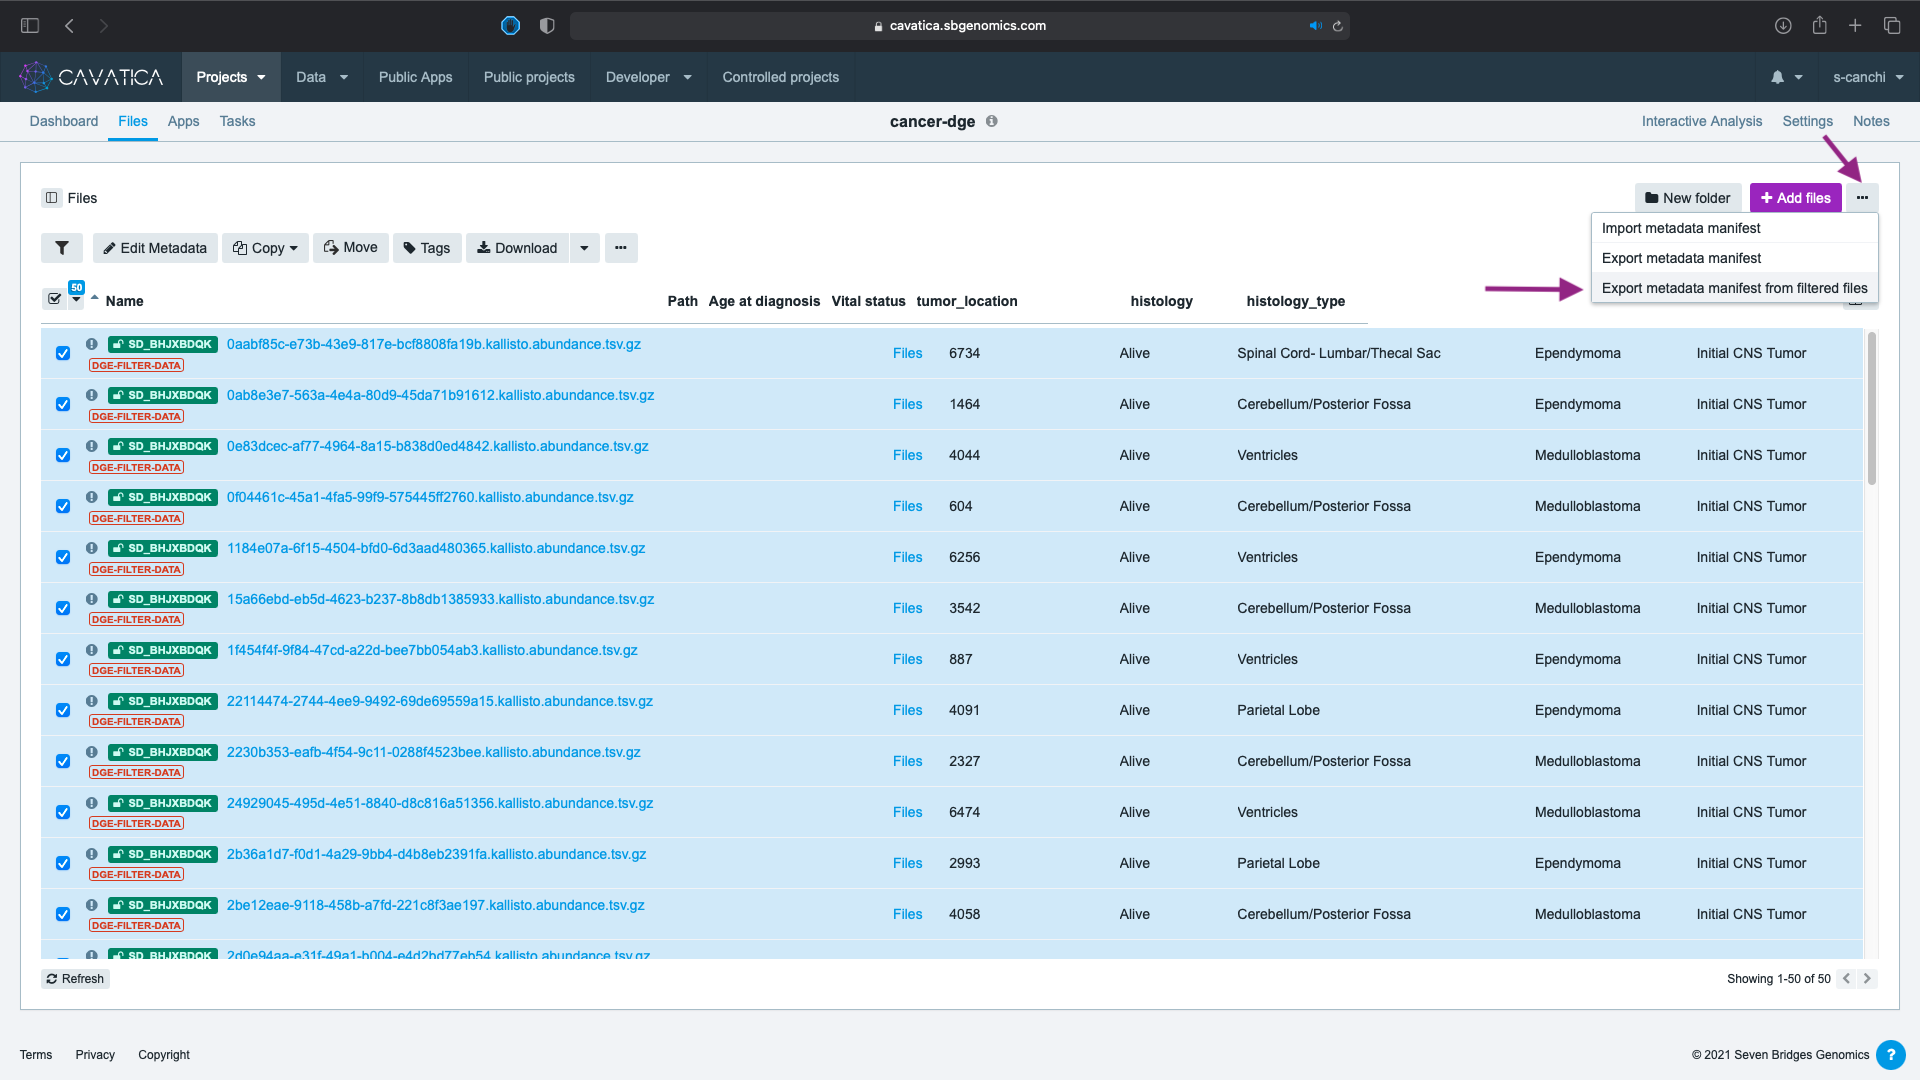
In our next lesson, we will learn to setup the DESeq2 app in our project folder.